Technical analysis was built for markets with thousands of independent participants, a deep order book, and years of price history. A memecoin has twenty real participants, no order book at all, and a chart that started this afternoon. Everything still gets drawn on it anyway — the flags, the divergences, the support lines — and most of it is measuring bots.
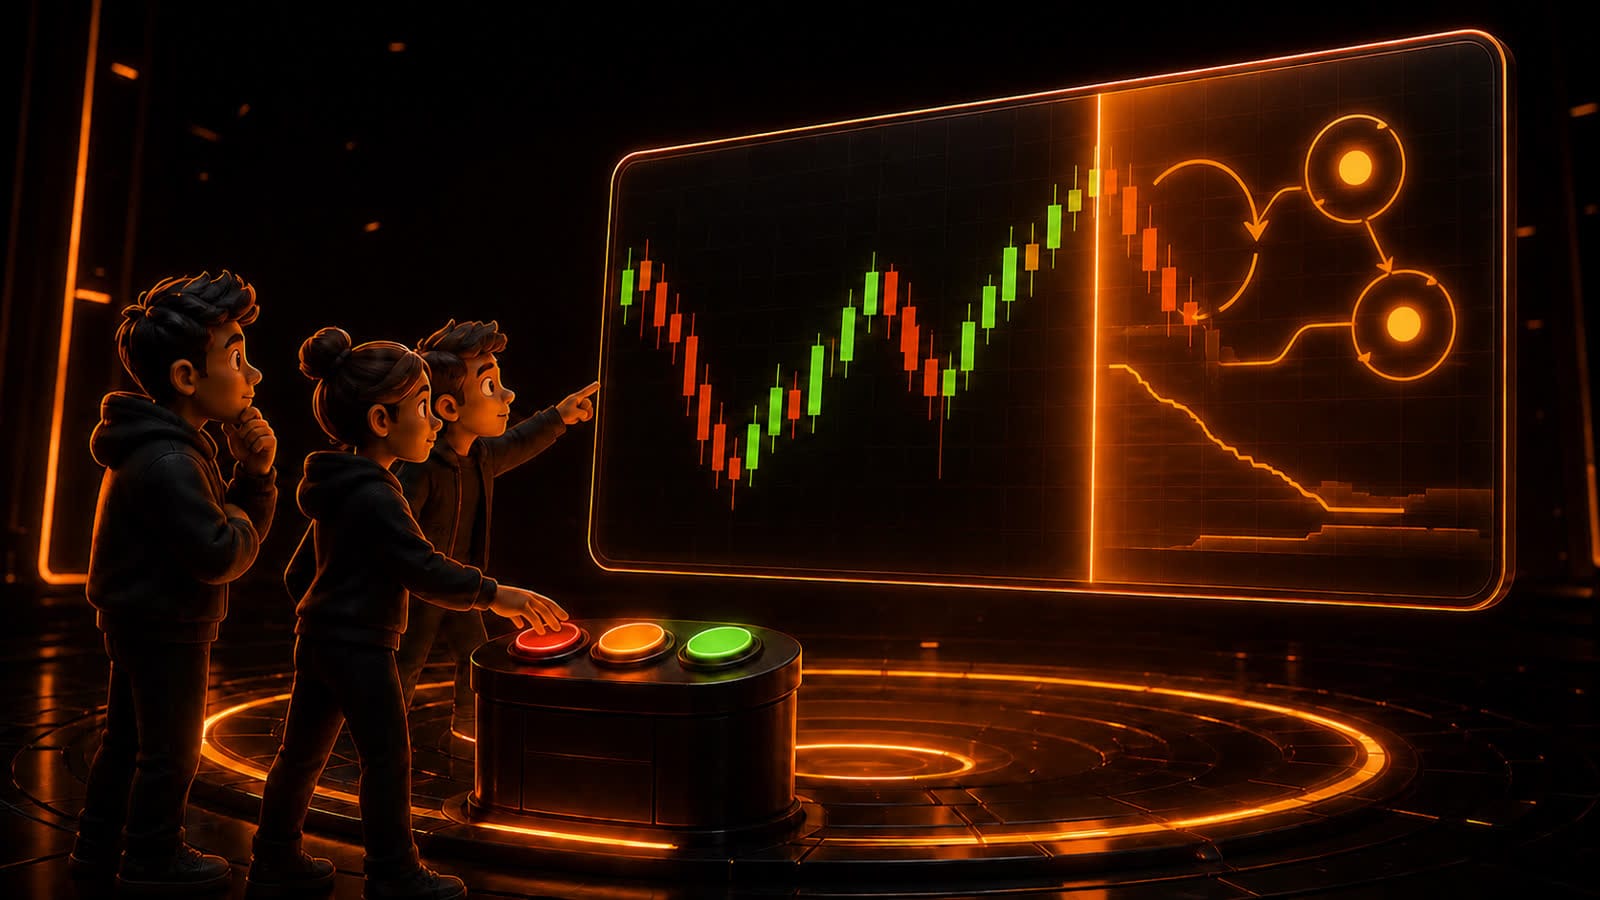
So here is a test. Twelve charts drawn fresh from a bigger bank — or take the full bank if you want the long version — each one a situation that happens on every memecoin, every day. You get exactly what a trader gets: candles, volume, and an age. You call it, and then the chart plays forward and shows you what was actually underneath — the wallets that traded, the pool depth, the venue change. You do not need to know TA to play; every question has a plain-English hint, and the ones that matter most are not TA questions at all.
One rule worth knowing before you start: you can turn the indicators on or off for any question, and we keep score of both. At the end you find out whether they helped.
The Memecoin Trading Test
Call each chart. Then see what was underneath it.
How well do you actually read a memecoin chart?
Twelve charts, drawn fresh from a bigger bank — or take the whole bank at once. Call each one, then see what was underneath it. No TA knowledge needed — every question carries a hint and a glossary.
Text version and answer key
Spoilers. Every question in the bank, with its answer and the mechanism behind it. A short run draws 12 of these 24 questions (4 from Who traded, 3 from Levels & liquidity, 3 from Indicators, 2 from Chart shapes) and reshuffles the options, so play the test above before reading on.
Each question carries a difficulty:
- Tourist — Answerable from the prompt and the hint alone
- Degen — Assumes you have watched a memecoin chart before
- Trenches — Needs the mechanism, not the shape
Who traded — The wallets behind the candles
Who traded 1 · Degen
Price spiked 22% and gave all of it back inside one minute, on the biggest volume bar of the session. What most likely happened?
Hint: A long upper wick means price went there and came straight back. The question is who took it there.
- Sellers rejected the level — Supply came in and pushed price back down (what a named textbook pattern would pick)
- An MEV sandwich bot — Bought ahead of someone’s buy, then sold into it in the same block ← correct
- A whale bought and took profit — One buyer straight in and back out
Answer: An MEV sandwich bot. One wallet bought and sold in the same block, with a victim’s buy filling between its legs — an MEV sandwich.
Why this happens: Three legs in one block: the bot buys ahead of a pending buy, the victim fills at the top it created, and the bot sells into it.
Terms used: Wick, Sandwich, Slot / block, Wallet
Who traded 2 · Tourist
Volume tripled over two hours and the chart went sideways. Holder count moved from 412 to 419. What is that volume?
Hint: Real buying leaves something behind: more holders. Ask what changed besides the volume bars.
- Real demand — Accumulation before a move
- Mostly bots — Wash trades and arbitrage round trips ← correct
- One whale building — A single buyer working an order
Answer: Mostly bots. Seven new holders cannot produce that volume. It is the same inventory moving back and forth.
Why this happens: Volume counts every trade, including bots trading with themselves. Real buying leaves new holders behind; a whale building would drain the pool and drift price up. This did neither.
Terms used: Volume, Wash trade, Holder count, Arbitrage
Who traded 3 · Tourist
Price steps down in near-equal increments every six minutes. Each step is a similar-sized sell, each from a different wallet. What are you looking at?
Hint: Organic selling is uneven — different sizes, random timing. This is not that.
- Holders taking profit — Independent sellers who happen to line up
- One position unwinding — Split across wallets on a timer ← correct
- A market maker quoting — Two-sided liquidity stepping down
Answer: One position unwinding. Independent sellers do not agree on size or spacing. Equal clips on a fixed interval is one seller running a schedule.
Why this happens: The giveaway is upstream of the chart: trace the funding and the wallets share a parent. Regularity is exactly what makes scheduled selling legible to everyone watching.
Terms used: Wallet, Bundle, Funding graph
Who traded 4 · Trenches
A buy wave lands: buy volume is enormous, but the green candles are small and the price barely lifts. Pool liquidity has not changed all day, and no sell prints as its own red candle. What is happening?
Hint: If buying that size is not moving price, something is meeting it.
- The chart is lagging — Your data source has not caught up
- Someone is selling into the buys — Filling inside the wave rather than against it ← correct
- The pool got deeper — Someone added liquidity to absorb it
Answer: Someone is selling into the buys. Buy volume with no price move means supply is being met at the moment it is demanded.
Why this happens: That is counter-selling seen from the outside — the seller fills inside existing buy flow, so the sells show in the trade record but never as their own red candles.
Terms used: Candle body, Counter trade, Liquidity
Who traded 5 · Degen
One wallet known for winning trades buys $3k of a quiet token. Within a minute, 150 smaller buys pile in and price jumps 35%. What is that wave of demand?
Hint: Ask how many independent decisions were made here. It may be fewer than the wallet count suggests.
- Organic discovery — The token is getting found by new buyers
- Copy traders mirroring one wallet — One decision, executed 150 times ← correct
- Wash bots inflating volume — Fake volume to draw attention
Answer: Copy traders mirroring one wallet. One good wallet bought, and the copy bots mirrored it within seconds. It is one decision wearing 150 wallets.
Why this happens: Copied flow unwinds the way it entered: when the leader sells, the mirrors sell with them, all at once. Demand that follows a wallet is only as durable as that wallet’s exit.
Terms used: Wallet, Copy trading, Volume, Holder count
Who traded 6 · Tourist
Overnight the holder count jumps from 800 to 4,100. Price has not moved and volume is near zero. What happened?
Hint: Adding a holder normally takes a buy. Ask what else can put tokens into a wallet.
- The token went viral — Thousands of new buyers found it
- A dust airdrop — Tokens were sent to thousands of wallets that never bought ← correct
- A new exchange listing — A CEX listed it and buyers flooded in
Answer: A dust airdrop. Tokens were airdropped as dust to thousands of wallets. Nobody bought anything — the metric moved, the market did not.
Why this happens: Holder count is a screener metric, and metrics get manufactured. Real distribution arrives with volume; a padded count is visible on-chain, and experienced buyers walk away when they see one. As a growth tactic it costs more trust than it buys.
Terms used: Holder count, Wallet, Volume, Airdrop
Who traded 7 · Degen
A partnership announcement drops and the chart is already up 60%. Zoom in: the buying started two minutes before the post went live. Who bought?
Hint: Put the timestamps side by side. The chart cannot react to news that has not been posted yet.
- Fast traders reacted instantly — News-reading bots caught the post early
- Insiders bought before their own announcement — The news was traded before it was public ← correct
- Coincidence — The pump and the post happen to line up
Answer: Insiders bought before their own announcement. The buys printed before the post existed. Whoever bought first did not read the news — they wrote it.
Why this happens: On memecoins the announcement is often the exit plan: insiders load up, post, and sell into the crowd that arrives. Check the order of timestamps before chasing any news candle — if the move came first, you are the liquidity it was waiting for.
Terms used: Wallet, Volume, Candle body
Who traded 8 · Degen
Your token bleeds 40% in an afternoon with no news. You dig into the sells and find the biggest ones came from a handful of wallets that never bought — each received its tokens by direct transfer a few weeks ago. Who is selling?
Hint: Tokens that arrive by transfer were given, not bought. Ask who gets given tokens — and what they promised in return.
- Airdrop farmers — Free tokens from a campaign, dumped on schedule
- The KOLs you paid in tokens — Marketing allocations, sold against the agreement ← correct
- A hacked team wallet — Someone drained an internal allocation
Answer: The KOLs you paid in tokens. Your KOLs sold: allocations transferred from the marketing wallet, dumped against the sell rules they agreed to.
Why this happens: It is one of the most common memecoin post-mortems — the crash traces back to paid promoters breaking their sell agreements. The payment transfers are public, so the receipts exist before the dump: teams that watch the wallets they have paid see it coming.
Terms used: Wallet, Transfer, Funding graph, KOL (key opinion leader)
Who traded 9 · Trenches
The best news your token ever got: a major exchange lists a perpetual on it. From that week on, every rally gets sold harder than before. What changed?
Hint: Before the listing, selling required holding. Ask who can sell afterwards.
- The listing was the top — Hype peaked and demand faded
- Anyone on earth can now sell it — Shorts exist: bearish opinions finally have a trade ← correct
- The exchange’s market maker holds it down — Listing desks manage the price
Answer: Anyone on earth can now sell it. Until the perp, only holders could sell. Now every skeptic, hedger, and funding farmer can — and their flow reaches your pool through arbitrage.
Why this happens: Shorts push the perp below spot; arbs buy the perp and sell your pool to close the gap. Whales hedge instead of defending rallies, and funding farmers sell strength by design. Demand did not change — the possible sellers went from your holders to everyone.
Terms used: Perpetual (perp), Arbitrage, Pool, Liquidity
Levels & liquidity — Where support comes from
Levels & liquidity 1 · Degen
The chart has bounced twice at the same price. Is that a support level?
Hint: Ask what would physically stop the next sell — memory, or liquidity.
- Yes — buyers remember it — Two touches make a level (what a named textbook pattern would pick)
- Only if the pool has depth there — Support is reserves, not memory ← correct
- No — support does not exist — Every level is arbitrary
Answer: Only if the pool has depth there. An AMM pool has no resting bids. The only thing slowing a sell is how much quote is left in the reserves.
Why this happens: Compute where the next $10k sell starts to hurt and you have a real level. Two touches tell you where a level used to be, often several liquidity events ago.
Terms used: Support, AMM (automated market maker), Reserves, Order book
Levels & liquidity 2 · Trenches
A pool holds $50k of quote liquidity. You buy $5k of the token in one transaction. Roughly how far does the chart price move?
Hint: Price is the ratio of the two reserves, and your buy changes both. It is not a straight line.
- About 5% — Proportional to your share of the pool
- About 10% — Roughly double your share
- About 21% — The square of the reserve change ← correct
Answer: About 21%. Spot price scales as the square of the reserve change: 10% more quote moves price by 1.1 squared, or +21%.
Why this happens: Your average fill is better than the final price, about half the move. That is why the candle you print is bigger than the one you paid for — and why slicing helps only when arbitrage refills the pool between clips.
Terms used: Price impact, Constant product (x·y=k), Quote asset, Slippage
Levels & liquidity 3 · Tourist
Two tokens sit at the same market cap and print similar-looking charts. One pool holds $90k of quote, the other $11k. A $10k sell arrives into each. What happens?
Hint: Same chart, very different pools. The chart does not show you the pool.
- Both drop about the same — Market cap is what matters
- The thin one drops far more — Impact scales with reserves, not with market cap ← correct
- Neither moves much — $10k is small at this size
Answer: The thin one drops far more. Market cap is an accounting figure. Liquidity is the money in the pool, and it alone decides what a sell does to price.
Why this happens: Same constant-product math, two outcomes: -19% against $90k of quote, -73% against $11k. Two charts can look identical and be entirely different risks.
Terms used: Liquidity, Market cap, Reserves
Levels & liquidity 4 · Degen
The token fell 70% in ten minutes — but total sell volume across the drop was under $2k, a fraction of an ordinary bar earlier in the day. What happened?
Hint: Price impact depends on what is in the pool. Ask what $2k of selling should normally be able to do.
- Panic selling — Everyone ran for the exit at once
- Liquidity was pulled; tiny sells did the rest — The pool emptied, so pocket-change sells moved the price ← correct
- A whale market-sold everything — One holder dumped their full position
Answer: Liquidity was pulled; tiny sells did the rest. The pool was drained first. With the reserves gone, sells worth pocket change moved price 70% — the volume never mattered.
Why this happens: Pulling liquidity does not move price by itself — reserves leave in ratio, so no red candle prints. It shows up one trade later, when a sell that used to cost 1% of impact suddenly costs 30%. Depth broke, not demand.
Terms used: Liquidity, Reserves, Price impact, Pool
Levels & liquidity 5 · Degen
After a brutal week you double the pool’s liquidity. The chart calms down — and the next buy wave, the size that used to move price 30%, barely prints 8%. The community says the market maker is suppressing the price. What actually changed?
Hint: Nobody is trading against the wave. Ask what the same buy does to a pool twice the size.
- Buyers lost interest — The wave was smaller than it looked
- Someone is selling into every pump — The rallies are being absorbed
- Depth cuts both ways — A deeper pool mutes dumps and pumps alike ← correct
Answer: Depth cuts both ways. Nothing about demand changed. Doubling the reserves roughly halves what any trade — buy or sell — can do to the price.
Why this happens: Liquidity is a dial, not a shield: the depth that stops a dump from cratering the chart is the same depth that stops a buy wave from ripping it. Teams add liquidity to calm sells and are then surprised the pumps calmed too — it is one setting, not two.
Terms used: Liquidity, Reserves, Price impact, Pool
Levels & liquidity 6 · Trenches
A week-old token has $400k of liquidity — remarkably deep for its size. The chat reads it as strength: “someone believes.” What is that depth?
Hint: Providing liquidity to a trending token loses to simply holding — or to leaving. Ask who accepts that loss.
- Proof of demand — Deep liquidity means big buyers are here
- Someone’s deliberate, losing position — LPing a memecoin bleeds; ask whose money it is and why it stays ← correct
- Fee-farmer capital — Neutral yield money chasing the swap fees
Answer: Someone’s deliberate, losing position. Depth is not demand — it is capital someone chose to park in a losing position. On a young memecoin that is almost always the team, and it can leave.
Why this happens: An LP sells into every rise and buys every dump; fees rarely cover that on a trending token. The launchpad’s seed is burned, fee farmers leave with the churn — what remains is usually the team, and unlocked depth is a decision someone can reverse.
Terms used: Liquidity, Pool, Reserves
Levels & liquidity 7 · Tourist
A friend finds “the same token” on another chain at 40% below the price you paid. Same name, same ticker, same logo. What did they find?
Hint: A token is a contract address on one chain. A name is just a name — anyone can use it anywhere.
- A discount — The market has not caught up across chains yet
- A vamp — a copy wearing the name — A clone launched to farm the original’s hype ← correct
- An arbitrage opportunity — Buy it cheap there, sell it dear here
Answer: A vamp — a copy wearing the name. A token is one contract on one chain. Same-name deployments elsewhere are vamps — clones launched to catch the overflow of someone else’s momentum.
Why this happens: Vamping is industrial: one click clones a running token’s name and logo. Even a real bridged wrapper is its own thin market — and a vamp has no link at all. The 40% “discount” is the price of an exit nobody will offer you. Check the address, not the name.
Terms used: Vamp, Bridge / wrapped token, Pool, Liquidity, Arbitrage
Indicators — What they measure here
Indicators 1 · Tourist
Price has tripled in two hours and RSI has sat above 70 for most of the run. Does that mean a reversal is due?
Hint: RSI only runs from 0 to 100. Ask what it can do when a move simply keeps going.
- Yes, it is overbought — Above 70 is the classic sell zone (what a named textbook pattern would pick)
- No — it pins high in any strong trend — The reading saturates while price keeps running ← correct
- Only if volume is falling too — Confirm it against a second indicator
Answer: No — it pins high in any strong trend. RSI is capped at 100, so a one-sided run parks it near the top and leaves it there.
Why this happens: It measures how one-sided recent candles have been, not how much further price can go. Selling every overbought reading in a trending memecoin means selling the first hour of every real move.
Terms used: RSI (Relative Strength Index), Overbought and oversold, Trend
Indicators 2 · Trenches
Price is making higher highs while volume falls. Textbook TA calls that a bearish divergence — interest fading as price rises. On a memecoin, what should you conclude?
Hint: The volume line is only as honest as the trades inside it.
- Bearish divergence — Fading interest, expect a reversal (what a named textbook pattern would pick)
- Nothing until you filter it — The falling part may be bots leaving ← correct
- Bullish — less selling pressure — Lower volume means holders are firm
Answer: Nothing until you filter it. Filtered, volume here was flat to rising. What fell away was wash and arbitrage flow, not buyers.
Why this happens: Any indicator built on volume inherits whatever is in the volume. On this asset class the filtering is not a refinement, it is the precondition for the reading meaning anything.
Terms used: Divergence, Volume, Wash trade, Higher high
Indicators 3 · Degen
Price has fallen back below VWAP after a pump. What does that actually tell you?
Hint: VWAP is an average of what people paid. Start there rather than with what it predicts.
- It is a sell signal — Losing VWAP means momentum is gone (what a named textbook pattern would pick)
- The average buyer is underwater — Most of today is holding a loss ← correct
- Price is undervalued here — Below average means cheap
Answer: The average buyer is underwater. VWAP is a cost basis, not a prediction: the average price everyone paid, weighted by size.
Why this happens: Price below VWAP tells you who is likely to sell into the next bounce. That is a question about positioning, not direction — and positioning is the only one VWAP can answer.
Terms used: VWAP, Cost basis, Volume
Indicators 4 · Trenches
Down 80% from its high, and every oscillator on the chart says deeply oversold. On a stock you would expect a bounce. Should you expect one here?
Hint: Ask where “oversold bounce” statistics come from — and what kind of assets were around to be counted.
- Yes — stretched is stretched — Oversold readings mean the selling is exhausted (what a named textbook pattern would pick)
- Only if the token is still alive — Reversion statistics come from markets where things survive ← correct
- No — memecoins never recover — Down 80% means it is finished
Answer: Only if the token is still alive. Mean reversion is a statistic about things that survived. Most memecoins at -80% are not stretched — they are ending, and no indicator distinguishes the two.
Why this happens: A stock at -80% still has a business underneath — the rubber band has an anchor. A memecoin’s anchor is attention, which mostly never returns. The bounce trade needs a reason the thing comes back; “it fell a lot” is not one.
Terms used: Overbought and oversold, RSI (Relative Strength Index), Trend
Indicators 5 · Trenches
SOL rips 20% today. Your token’s chart barely moves, and the community calls it “stability” — holding its value on a wild day. What actually happened?
Hint: The chart you watch is in dollars. The pool trades something else. Ask what the ratio did.
- A quiet day — No news, no flow — flat is flat
- It kept pace with SOL — Matching a 20% day without dropping is strength
- It fell, and the rally hid it — Someone was selling all day; the quote’s move papered over it ← correct
Answer: It fell, and the rally hid it. Flat in USD on a +20% SOL day means the SOL ratio — the thing the pool actually trades — fell 17%. Holders were selling into the quote’s rally all day.
Why this happens: Every memecoin chart is a ratio wearing a dollar costume: a “breakout” can be the quote’s move, and “stability” can be a hidden exit. When the quote asset moves hard, read the pool’s own chart first — that is where demand, or its absence, lives.
Terms used: Quote asset, Pool, Reserves
Chart shapes — Shapes that have a cause
Chart shapes 1 · Degen
The chart jumps, prints one enormous volume bar, and the candle rhythm changes completely afterwards. Nothing else about the token changed. What was that?
Hint: Some memecoin chart shapes have a mechanical cause rather than a psychological one.
- A whale entered — One large buy repriced the token
- The token graduated — The curve completed and a DEX pool was seeded ← correct
- A rug in progress — Liquidity being pulled
Answer: The token graduated. The curve completed. The launchpad seeded a real pool with what it raised, and trading moved venue.
Why this happens: The participants change with the venue: after graduation you inherit arbitrage bots, snipers, and everyone else on the chain. Read the shape as a venue change, not a signal.
Terms used: Graduation, Bonding curve, Pool, Liquidity
Chart shapes 2 · Degen
A token graduates and within a minute the fresh pool is down 30%. The chat calls it a law of nature: “they always dump the graduation.” Why is the rule mostly true?
Hint: The earliest curve buyers are sitting on the biggest gains. Ask what they were waiting for.
- The launchpad dumps its cut — Graduation is the platform selling on you
- Graduation is the first real exit — Curve profits meet deep liquidity for the first time ← correct
- The pool opens at a discount — The DEX price starts below where the curve ended
Answer: Graduation is the first real exit. The earliest buyers were up 5–10x with nowhere to sell size. The seeded pool is the first deep exit — and everyone knows the date.
Why this happens: Selling size on the curve means crawling back down your own price impact, so early profit waits. Graduation concentrates liquidity at one public moment — and everyone who waited shows up at once. Demand strong enough to absorb that is the actual test.
Terms used: Graduation, Bonding curve, Liquidity, Price impact
Chart shapes 3 · Tourist
A brand-new token opens with one enormous green candle that immediately gives back most of it. Volume on the way down is as big as on the way up. What is that shape?
Hint: Ask who was able to buy in the very first seconds, and what they were there for.
- The launch failed — Nobody wanted it and it died on arrival
- First-block buyers cashing out — The supply bought at the open being sold back ← correct
- The team dumping its allocation — One wallet unloading everything at once
Answer: First-block buyers cashing out. Snipers bought the first block and sold into the first wave of real buyers. The volume on both sides is the same supply changing hands.
Why this happens: It is the most common opening shape on a memecoin, and it is not a verdict on the token — those sellers were never holders. What the chart does after that supply clears is the actual signal.
Terms used: Sniper, Volume, Wallet
Glossary
The plain-English definitions the quiz offers behind every question. They explain the vocabulary only — never the answer.
| Term | Meaning |
|---|---|
| Airdrop | Tokens sent free to wallets, often tiny "dust" amounts to thousands of addresses at once. Inflates holder count without any buying. |
| AMM (automated market maker) | A trading contract that prices a token from a formula over its own reserves instead of matching buyers to sellers. Almost every memecoin trades against one. |
| Arbitrage | A bot buying on one venue and selling on another to close a price gap. It creates volume without representing new demand for the token. |
| Bonding curve | The pricing formula a launchpad sells a new token along: every purchase raises the price of the next one. It runs until the token graduates. |
| Bridge / wrapped token | A mechanism that locks a token on its home chain and issues a copy on another. The copy trades in its own pools, at its own price, with its own — usually far thinner — liquidity. |
| Bundle | A set of buys from many wallets landing together, usually in a token’s first block, so one party can acquire supply at the open. |
| Candle body | The thick part of a candle, from the open price to the close. The thin lines above and below are the wicks — the extremes price reached but did not hold. |
| Constant product (x·y=k) | The rule most pools price by: the two reserves multiplied together stay constant, so removing tokens from one side raises the price of the other. |
| Copy trading | Bots that mirror a chosen wallet’s trades automatically, within seconds. One influential buy can fan out into hundreds of copies — a crowd’s footprint from a single decision. |
| Cost basis | What a holder actually paid. Compared against the current price it tells you whether they are sitting on a profit or a loss. |
| Counter trade | Selling a fixed share of each buy that lands (or buying into sells), so execution happens inside someone else’s flow rather than as its own event on the chart. |
| Divergence | When price and an indicator disagree — for example price making higher highs while volume falls. Textbook TA reads it as a warning. |
| Funding graph | The on-chain trail of which wallet sent money to which. It reveals whether “different” wallets share a common source. |
| Graduation | The moment a bonding curve completes: the launchpad seeds a real DEX pool with what it raised plus the unsold supply, and trading moves there permanently. |
| Higher high | Each peak in price exceeding the one before it — the basic definition of an uptrend. |
| Holder count | How many distinct addresses hold the token. Real buying tends to raise it; inventory moving between the same wallets does not. |
| KOL (key opinion leader) | An influencer paid to promote a token, often in the token itself. Their wallets hold given, not bought, tokens — and how they exit is part of the deal. |
| Liquidity | The money actually sitting in the pool. It decides how far a trade moves the price — and it is not the same thing as market cap. |
| Market cap | Price multiplied by total supply. An accounting figure — it says nothing about how much money is in the pool. |
| Order book | The list of resting buy and sell orders on an exchange. A DEX pool has none: there is one curve and no resting bids. |
| Overbought and oversold | Readings conventionally taken to mean a move has gone too far, too fast — for RSI, above 70 is overbought and below 30 is oversold. |
| Perpetual (perp) | A futures contract tracking a token’s price on an exchange, letting anyone go long or short with leverage — no need to hold the token. Tied to the spot price by funding payments and arbitrage. |
| Pool | The pair of reserves a token trades against — some of the token, some of a quote asset like SOL. Trades swap one for the other. |
| Price impact | How far your own trade moves the price before it fills. It grows faster than your trade size, not in step with it. |
| Quote asset | What the token is priced in — SOL, ETH, BNB, or a stablecoin. The quote side of the pool is what a buy adds to. |
| Reserves | The two balances held in a pool. Their ratio is the price, and their size is what makes a trade cheap or expensive. |
| RSI (Relative Strength Index) | A 0–100 indicator comparing the size of recent gains to recent losses over a lookback window. Below 30 is conventionally called oversold, above 70 overbought. |
| Sandwich | A bot trading on both sides of yours in the same block — buying ahead of your buy, or selling ahead of your sell — and pocketing the price move your own order created. |
| Slippage | The gap between the price you saw and the price you got. Your slippage setting is the worst fill you have agreed to accept. |
| Sniper | A bot that races to buy a token in its first block, before anyone can trade it by hand. |
| Slot / block | One unit of blockchain time. Trades in a slot land in a definite order — which is what lets a bot place its trades immediately before and after yours. |
| Support | A price level where buying is expected to stop a fall. On an order book that means resting bids; on a pool it can only mean depth. |
| Transfer | Tokens moved between wallets directly, without a trade. Transfers change balances but never print on the chart or move the price — which is why sellers can appear who never bought. |
| Trend | A sustained direction over enough candles to be more than noise. How many candles “enough” is depends on how many independent participants made them. |
| Vamp | A copycat token cloned from one that is already running — same name and logo, launched in seconds to catch the original’s overflow attention. Short for vampire: it feeds on someone else’s momentum. |
| Volume | The total value traded in a period. It counts every trade, including bots trading with themselves. |
| VWAP | Volume-weighted average price — the average price paid across the session, weighted by trade size. Read it as a cost basis rather than a signal. |
| Wallet | One on-chain address, and the thing that signs each trade. A single person or bot can control hundreds, which is why wallet count is not participant count — but seeing the same one on both sides of a bar is decisive. |
| Wash trade | A trade where the same party is on both sides. It manufactures volume without transferring any real risk. |
| Wick | The thin line above or below a candle body, marking a price that was reached but not held. A long upper wick means price spiked and came straight back; a long lower wick, the reverse. |
Memecoin charts are not stock charts
Every tool in the toolkit still runs on a memecoin chart — an indicator will return a confident number on any series you feed it. What is missing is the market those numbers were calibrated against, and a token that launched this afternoon is missing all of it at once.
Four structural differences do most of the damage:
- A handful of wallets draw the candles. Patterns describe crowd behaviour, and on a young token there is no crowd yet — a couple dozen real participants, and bots that can author the tallest bar of the session on their own. A shape made by three actors is not evidence of the thing that shape usually implies.
- There is no order book, so there are no levels. A stock can hold a price because bids are resting there. An AMM pool has no resting orders: one curve, and the only thing slowing a sell is how much quote is left in the reserves. Support on a memecoin is a number you compute from depth, not a line you draw from memory.
- Volume counts trades that transferred no risk. Wash trades, arbitrage round trips, and MEV bots recycling the same inventory all land in the volume bar next to real buying. Every volume-derived signal inherits that, and filtering can invert a divergence outright. The cheap check is whether holder count grew along with the volume.
- The history is shorter than the lookback. Indicators were calibrated on daily bars spanning years. A 14-period reading on a 1-minute chart covers fourteen minutes, and on a three-hour-old token there is no longer timeframe to fall back to.
Normal crypto sits in between. Bitcoin and the large caps have deep books, long histories, and enough independent participants that the conventional toolkit behaves roughly as advertised. The further down the liquidity curve you go the more of the list above applies, until at a token measured in hours, all of it does.
There is one more difference, and it is the one that matters most: the problem TA exists to solve is not the problem you have. Charting grew up in markets where you cannot see who is on the other side of your trade — the shapes are an inference about invisible participants. On-chain, those participants are not invisible. Every trade carries a wallet, every wallet has a history, and the pool's depth is a public number. Reading shapes here means choosing a blindfold in front of an open record.
What to read instead
The useful replacement is not a better indicator. It is a shorter question: who was on the other side, and how deep was the pool? Both are answerable from the trade record in seconds, and neither needs a lookback window to mean something.
The inputs that actually carry information on a young token are holder count and its rate of change, the ratio of unique buyers to unique sellers, first-time buyers versus full exits, the funding graph behind the wallets doing the trading, and pool depth alongside price rather than three clicks away from it. None of these are exotic. They are just not on the chart, which is why almost nobody looks at them.
Some chart shapes are worth learning, but only the ones with a mechanical cause: the sniper wick, the graduation gap where a bonding curve completes and a real pool gets seeded, the equal-clip staircase of a position unwinding across wallets, the wash plateau where volume climbs and holder count does not. Each of those is a shape you can confirm on-chain rather than believe in. If you want the machinery behind the graduation one, we took every launchpad's pricing model apart in what are memecoin bonding curves.
FAQ
Does technical analysis work on memecoins? Parts of it, on tokens old enough and liquid enough to have a real participant base. On a token that is hours old, most of the toolkit is measuring bot flow through thin liquidity — the indicators return numbers, but the numbers do not mean what the textbook says they mean. The parts that survive best are the ones that describe positioning rather than predict direction, such as VWAP read as a cost basis.
What should I look at instead of indicators? Holder count and its rate of change, unique buyers versus sellers, the funding graph behind the wallets trading, pool depth relative to your intended size, and whether the volume survives filtering for wash and arbitrage flow. These answer questions about who is trading and what a sell would do — the two things that actually decide your outcome.
Why is volume unreliable on memecoins? Because a large share of it can be the same inventory moving back and forth: wash trades, arbitrage bots closing gaps, and MEV bots round-tripping. None of that represents new demand, and all of it lands in the volume bar. The check is simple — compare volume growth against holder-count growth.
Is support and resistance real on a DEX? Support in the order-book sense is not, because there are no resting bids. What is real is liquidity depth: the price at which a sell of a given size becomes expensive, computed from the pool's reserves. That is a level you can calculate rather than draw.
What timeframe should I use on a memecoin? A far shorter one than you would use anywhere else. A memecoin's entire life is often measured in hours rather than years, so 1-second and 1-minute charts are the ones that actually contain its history — a 4-hour candle can swallow the whole move. The trade-off is that the shorter the timeframe, the larger the share of what you are looking at that was drawn by bots, which is why who traded matters more than the shape at these speeds.
Sumo is a trading and market-making platform for token teams, and the reason we can label these charts is that our engine trades on the same trade record: every transaction tagged with MEV, arbitrage, holder tier, and source platform, streamed from the chain rather than polled from an API. If you want to see your own token's trades labelled that way, that is what Sumo does.
Related Sumo docs
Where the inputs this test argues for actually live in the product:
- Live trading — the streamed trade record behind every reveal: who traded, tagged as MEV, arbitrage, sniper, or organic.
- Surveillance — holder distribution and the funding graph behind the wallets, which is how insider and bundle clusters get named.
- Impact calculator — pool depth priced as what a sell of a given size actually costs, the level that replaces a drawn support line.
- Counter trade — selling inside someone else's buy flow rather than printing your own candle.